Internal Hardware Platform Program
Building a Single Source of Truth for Cross-Functional Hardware Planning
One YAML model now drives architecture views, summaries, and planning validation across EE/ME/FW
The Challenge
Executive Summary
This project addresses a common hardware-development bottleneck: planning decisions were being made from disconnected artifacts across EE, ME, and FW. The solution was to build HardwareGraph (hwgraph), a manifest-driven system where a single YAML model powers architecture diagrams, cost/energy summaries, validation checks, and review workflows.
The result is a shared, early, and continuously updated view of the full system, improving planning quality, reducing cross-team ambiguity, and catching risks before they become integration problems.
1) Background and Business Context
In multi-disciplinary hardware programs, each engineering department naturally develops its own tools and views:
- EE works from schematics and interface maps
- ME works from enclosure/fit constraints and assembly structure
- FW works from driver readiness, pin mappings, and bus topology
This is efficient locally, but globally it introduces friction:
- Data is duplicated across formats
- Updates do not propagate consistently
- Planning meetings reconcile mismatched assumptions rather than evaluating tradeoffs
For this project, leadership needed a way to answer planning questions earlier:
- Are we on track for BOM target cost?
- Is energy usage aligned with battery-life targets?
- Are FW dependencies and driver status visible before implementation?
- Are EE/ME/FW dependencies clear enough for sequencing and resourcing?
The team's requirement was clear: one source of truth that all engineering departments can trust during planning, not only during late integration.
2) Problem Statement
Before hwgraph, planning suffered from four core issues:
- Fragmented system understanding: no single artifact represented the full system across EE/ME/FW.
- Late visibility on constraints: cost/power/driver readiness were reviewed late or manually.
- High coordination overhead: design reviews spent time aligning baseline facts.
- Risk discovered too late: interface conflicts, removed-part references, and budget overruns surfaced during execution instead of planning.
This produced avoidable rework and made roadmap confidence lower than it should have been.
Our Approach
3) Goals and Success Criteria
The project set out to create a planning system with these outcomes:
- A canonical system model all disciplines can edit and review
- A visual representation for fast cross-team understanding
- A quantitative summary for early tradeoff analysis (cost, power, battery life)
- Automated checks to detect planning risks in CI
- A review experience that is easy for stakeholders who do not author raw draw.io files
Success was defined as moving from "multiple partial truths" to "one integrated system picture," available continuously throughout development.
4) Solution Overview
The solution was implemented as hwgraph, a CLI and viewer workflow with one canonical input:
manifest.yaml is the source of truth for project, components, topology, power, and layout metadata.
From that manifest, the system generates and maintains:
- Draw.io multi-tab architecture
- EE, ME, FW, and Summary tabs
- Two-way synchronization
- Diagram layout edits can be synchronized back to YAML
- Validation pipeline
- Constraint and consistency checks
- Read-only review app
- Search, inspect metadata, and navigate by subsystem/component
This architecture balances two needs:
- Human-friendly visual collaboration
- Machine-checkable, versioned engineering data
5) Product Capabilities Implemented
A) Model-Driven Diagram Generation (generate)
From one manifest, the tool creates a .drawio diagram with four perspectives:
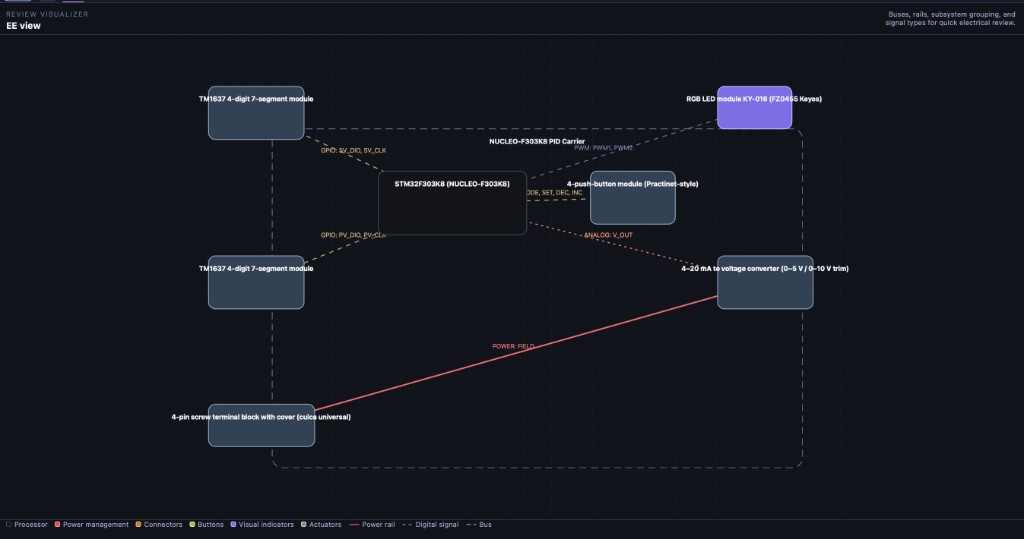
- EE tab: subsystem-colored components and connection styles by bus
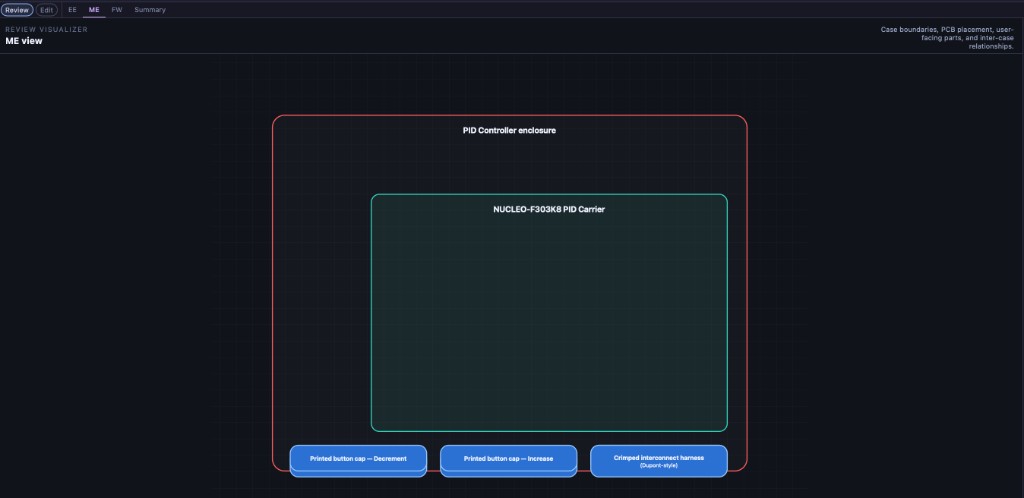
- ME tab: enclosure and mechanical context (including inter-case relationships)
- FW tab: software integration context (drivers, DTS compatibility, pin metadata)
- Summary tab: planning metrics in dashboard form
This gives teams both domain-specific and program-level views without duplicating data entry.
The Solution
B) Diagram-to-Model Sync (sync-back)
When teams adjust layout in draw.io, those positional changes are written back to layout.ee/me/fw in manifest data.
This keeps diagram structure and canonical model aligned over time, reducing drift.
C) Planning Validation (validate)
CI-ready checks automatically detect planning risks such as:
- I2C address conflicts
- Pin conflicts
- Cost overrun vs target
- Regulator overload
- Battery-life target failures
- References to removed components in connections
This turns architectural assumptions into explicit quality gates.
D) Review-First Visualization (serve)
A local React viewer provides a design-review surface with:
- Tab navigation across EE/ME/FW/Summary
- Component inspector with rich metadata
- Search by ID/name/part/subsystem
- Draw.io integration for exact diagram parity
This makes the model consumable to broader stakeholders beyond the authors.
6) Why the "Single Source of Truth" Worked
The key design principle was: author once, reuse everywhere.
- System facts live in one place (
manifest.yaml) - Every output (diagram, summary, reviewer experience, CI validation) derives from that same model
- Cross-team conversations are anchored to shared data, not divergent snapshots
This reduced the "translation tax" between EE/ME/FW and replaced status debates with decision-making.
The Results
7) Planning Outcomes and Value Delivered
Cross-Department Alignment
All engineering departments can reference the same architecture, components, and status metadata during planning. This improves meeting quality and dependency clarity.
Earlier Tradeoff Decisions
The Summary layer exposes cost and energy implications early enough to influence design direction, rather than becoming post-hoc reports.
Reduced Rework
Automated checks catch structural issues before they propagate downstream, avoiding expensive late fixes.
Better Execution Confidence
Because roadmap assumptions are validated against a shared model, planning artifacts are closer to implementation reality.
8) Representative Example: BLE Indicator Project
In the BLE indicator example included in the repository, the system demonstrates end-to-end planning visibility:
- Full multi-tab architecture is generated from manifest data
- Summary tab computes cost and power/battery metrics
- Validation highlights target-risk conditions (for example, duty-cycle battery tradeoffs)
- Review mode allows teams to inspect exact component metadata and dependencies quickly
This demonstrates how teams can move from static docs to a living system model that supports real planning decisions.

9) Technical Design Decisions that Enabled Adoption
- YAML as canonical source: human-readable, versionable, merge-friendly
- Draw.io interoperability: fits existing engineering habits; minimizes workflow disruption
- CLI-first operations: easy to automate in local workflows and CI
- Read-only reviewer mode: keeps review accessible while preserving model integrity
- Phased delivery approach: generation/sync first, then summary/validation, then review UI
These decisions made the solution practical, not just technically correct.
10) Lessons Learned
- A source of truth only succeeds if it serves all disciplines, not just one.
- Visualization alone is insufficient; it must be paired with machine validation.
- Planning quality improves dramatically when cost and energy are integrated into architecture artifacts.
- Adoption is strongest when new tooling augments familiar workflows rather than replacing them.
11) Conclusion
This project transformed planning from a fragmented, document-heavy process into a model-driven engineering workflow.
By establishing one source of truth across EE, ME, and FW and connecting it to diagrams, metrics, and validations, the team gained earlier and clearer visibility into full-system design, cost, and energy implications.
The net effect is better planning decisions, fewer late-stage surprises, and stronger alignment across engineering departments.
We replaced planning debates about conflicting documents with faster decisions grounded in one shared model.
Project Details
- Client
- Internal Hardware Platform Program
- Industry
- Embedded Systems & Hardware R&D
- Service
- Digital Transformation